|
SEPPA2---more refined server to predict spatial epitope considering species of immune host and subcellular localization of protein antigen
SEPPA (Spatial Epitope Prediction of Protein Antigens) Version 2
is presented here as an updated server of SEPPA1 for conformational B-cell epitope prediction.
With PDB structure as input, each residue in the query protein will be given a score according
to not only its physical-chemical properties and neighborhood residues' information but also its
subcellular localization and species of immune host. Higher score corresponds to higher
probability of the residue to be become an epitope residue.
Submission methods:
- Submit the entry of an existing PDB ID.
- Users can submit their own protein structures of their own in PDB format
(PDB format).
* Specify the chain(s) ID you are interested if any in each submission method.
* The whole structure will be calculated if the chain is not speficied.
* For local PDB files, please note that chain column cannot be empty.
You can add any single, character ('0-9' or 'A-Z')as chain ID to avoid error message.
Batch query:
Multiple PDB ID entries are allowed to submit in batch query.
Each entry should specify PDB ID, subcellular localization, host specieand chain ID(s),
which are separated with space(s) in one line. Example can be found here.
In batch query mode, each PDB enry is set as one line in below format:
"PDB ID(4 characters) + single space + 1 character of subcellular localization
+ single space + host specie + single space + chain ID X + Chain ID Y ..."
Subcellular localization:
M: membrane; S: secreated;
Null: not specified.
Host species:
Mus: mouse; Homo: human;
Null: not known or Others
Threshold:
For SEPPA Version 2, we presented 9 different models for different subcellular localization
and species of immune host. The threshold recommended for each model is displayed in below
Table1 . And the corresponding AUC values is illustrated in Table 2. Users can set different
thresholds. Under a lower threshold, more residues will be included as predicted epitope
residues. It should be noted that, lower threshold will always lead to the increase of
the true positive rate, but also the increase of false positive rate as well meanwhile.
Table1. Suggested Threshold Table:
| hosts\localization | Unspecified | Membrane | Secreted |
| Unspecified | 0.1 | 0.08 | 0.1 |
| Homo | 0.1 | 0.05 | 0.09 |
| Mus | 0.12 | 0.16 | 0.16 |
Table2. Performance of SEPPA(AUC value for each cell) according to 5-fold cross validation on training data:
| hosts\localization | Unspecified | Membrane | Secreted |
| Unspecified | 0.745 | 0.767 | 0.742 |
| Homo | 0.736 | 0.782 | 0.751 |
| Mus | 0.752 | 0.808 | 0.823 |
Example: PDB ID: 2B2X chain ID: B
Infromation selected: Subcellular localization---Membrane AND Host of species---Mus
- Part I: summary of the prediction result
***********************************************************************************
Chain: B
Threshold: 0.06
Antigen Protein Subcellular Localization: Membrane
Species of the Immune Host: Mus
Number of total residues: 176
Number of predicted epitope residues under this threshold: 48
***********************************************************************************
This part is a summary of the prediction result.
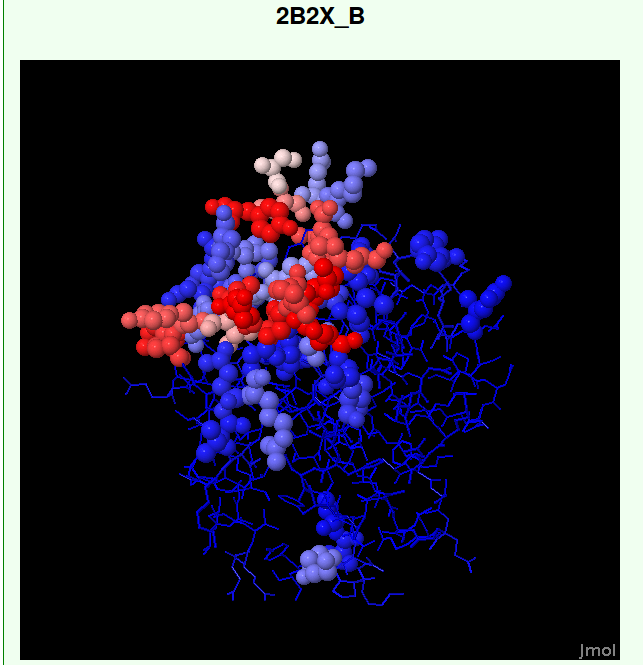
- Part II: visualization of the prediction result
***********************************************************************************
View 3D structure in Jmol
Figure 2. Visualization of SEPPA prediction result.
***********************************************************************************
The predicted epitope could be visualized with Jmol in different renderings.
In the visualized structures, a RWB gradient is used for
result display: tints from blue to red represent a rising antigenicity.
By selecting the "Highlighted epitope residues predicted" checkbox, Jmol changes the rendering
so that the predicted epitope residues are solid spheres(Figure 2).
Access the Jmol menu by clicking the word "Jmol" in the lower right corner of the structure display area.
- Part III: a glance of the prediction result
***********************************************************************************
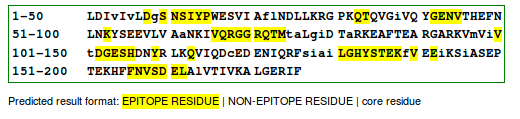
***********************************************************************************
The prediction result is displayed in a table as above. Residues are listed sequentially.
The predicted epitope residues are highlighted in yellow. The core residues are shown in lowercase.
- Part IV: score file of the prediction result
***********************************************************************************
| B | 147 | LEU | 0.03 |
| B | 148 | ASP | 0.03 |
| B | 149 | ILE | 0.02 |
| .... |
| B | 168 | PHE | 0.00 |
| B | 169 | LEU | 0.00 |
| B | 170 | ASN | 0.01 |
| .... |
| B | 295 | SER | 0.51 |
| B | 296 | THR | 0.67 |
| B | 297 | GLU | 0.33 |
***********************************************************************************
The residues B147, B148 and B149 are predicted as non-epitope residues. The residues B168 and
B169 are predicted as core ones. The residues B295 B296 and B297 are predicted
as epitope ones.
The complete score file contains four columns, which are chain identifier,
residue sequence number, residue name and SEPPA score.
* The label "core" is used in the score column to represent a residue in the protein core.
ANNOUNCEMENT:
The residue solvent accessible areas are calculated with
Naccess V2.1.1.
Hubbard SJ, Thornton JM. 'NACCESS',
Computer Program. Department of Biochemistry and Molecular Biology,
University College London. 1993.
Jmol has been implemented into SEPPA server.
Jmol: an open-source Java viewer for chemical structures in 3D.
|