Content
A. Submission entrance
Step1: Transcriptomics data submission
upload data
Step 2: Data class submission
1)Sample Class
2)Additional information submission (optional)
3)Email address (optional)
4)Submission
5)Status check
B. Example
1)Submission
1.1)Expression data
1.2)Class data
2)Results
2.1)Information of the result page
2.2)Results of integrated cancer transcriptomics data
2.3)visualization of processed data
2.4)Differentially expressed genes
C. Browser compatibility
A. Submission entrance
Two steps are needed for running Rank-In
Step1: Transcriptomics data submission
1 upload data
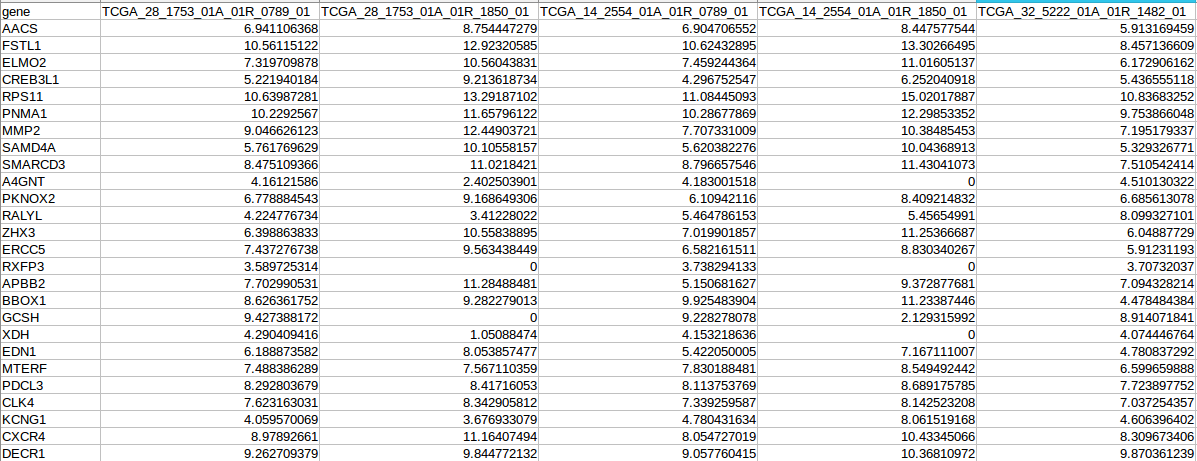
The upload data should contains expression matrix saved as a tab delimited text file (.txt) with rows for genes and columns for samples. This is the typical genes by samples matrix found in gene expression analyses. Each gene/sample name should be unique(the names of genes can be entrezid, gene symbol, ensemble, etc). The submission file format is as below; users can click "Download Example" to download standard format file in the submission page.
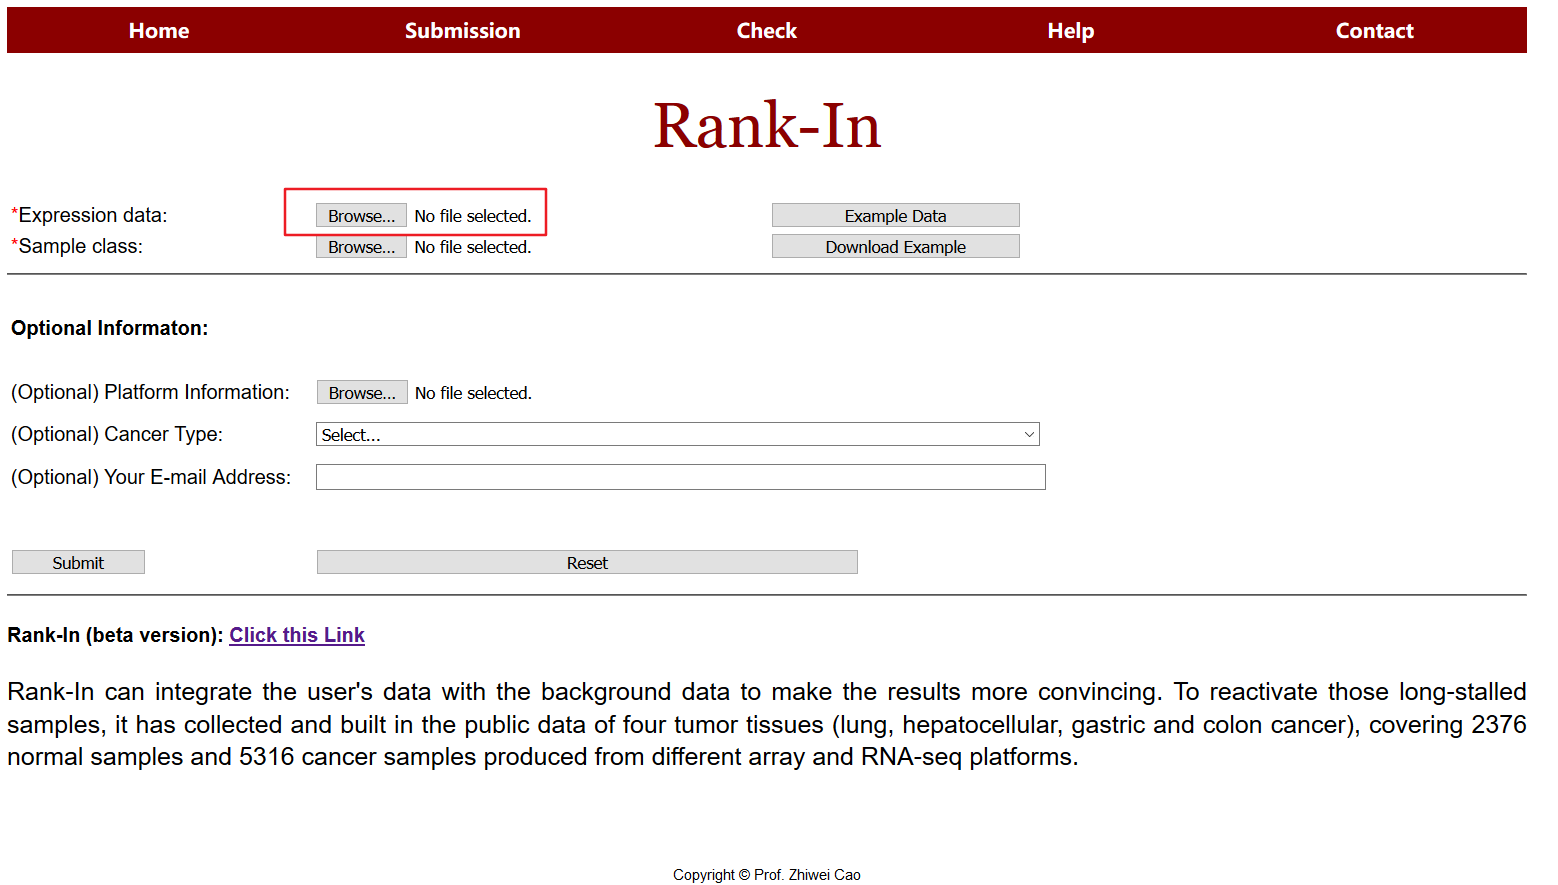
Table1 format of uploaded expression data.
| #NAME | Sample1 | Sample2 | Sample3 | Sample4 |
| Gene1 | 3.06 | 2.25 | 1.15 | 6.64 |
| Gene2 | 1.61 | 0.27 | 0.71 | 0.62 |
| Gene3 | 1.08 | 1.36 | 1.02 | 1.32 |
| Gene4 | 0.67 | 1.22 | 0.17 | 0.97 |
Please note that:
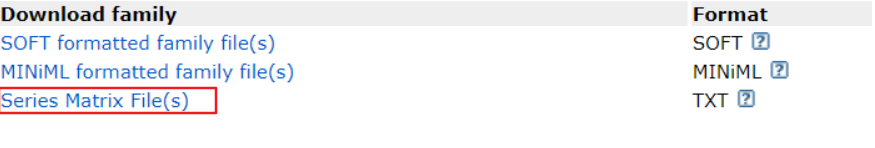
1) For microarray data, gene expression intensity would be used. For public microarray data, users could download expression matrix from GEO “Series Matrix File(s). Users could delete the experimental annotation information and get the expression matrix. In this matrix, each row represents a probe. Then the users would annotate each probe to gene from platform annotation file. When multiple probes or transcripts are mapped to the same gene, the expression needs to be replaced by mean or median into a single value for that gene.
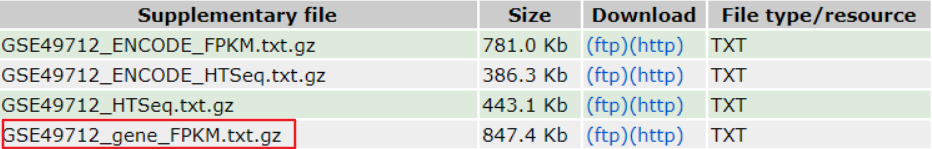
2) For RNA-seq data, the fragments per kilobase of transcript per million fragments mapped (FPKM), Transcripts Per Kilobase of exon model per Million mapped reads (TPM) or trimmed mean of M values(TMM) should be pre-calculated. For some of the public RNA-seq data, users could download FPKM matrix form GEO “Supplementary file”.
3) It is critical to properly label your gene so that they can be recognized and compared. Gene symbol is supported.
4) There is a 50MB limit for the uploaded data. For gene expression profiles with 20 000 genes, this corresponds to about 200 samples.
Step 2: Data class submission
2.1 Sample Class
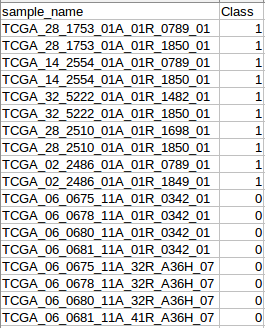
users will upload a class file additionally, which numbers the type of samples, for example, “1” means samples from normal tissue, “2” means samples of cancer subtype1, “3” means samples of cancer subtype2, and so on.
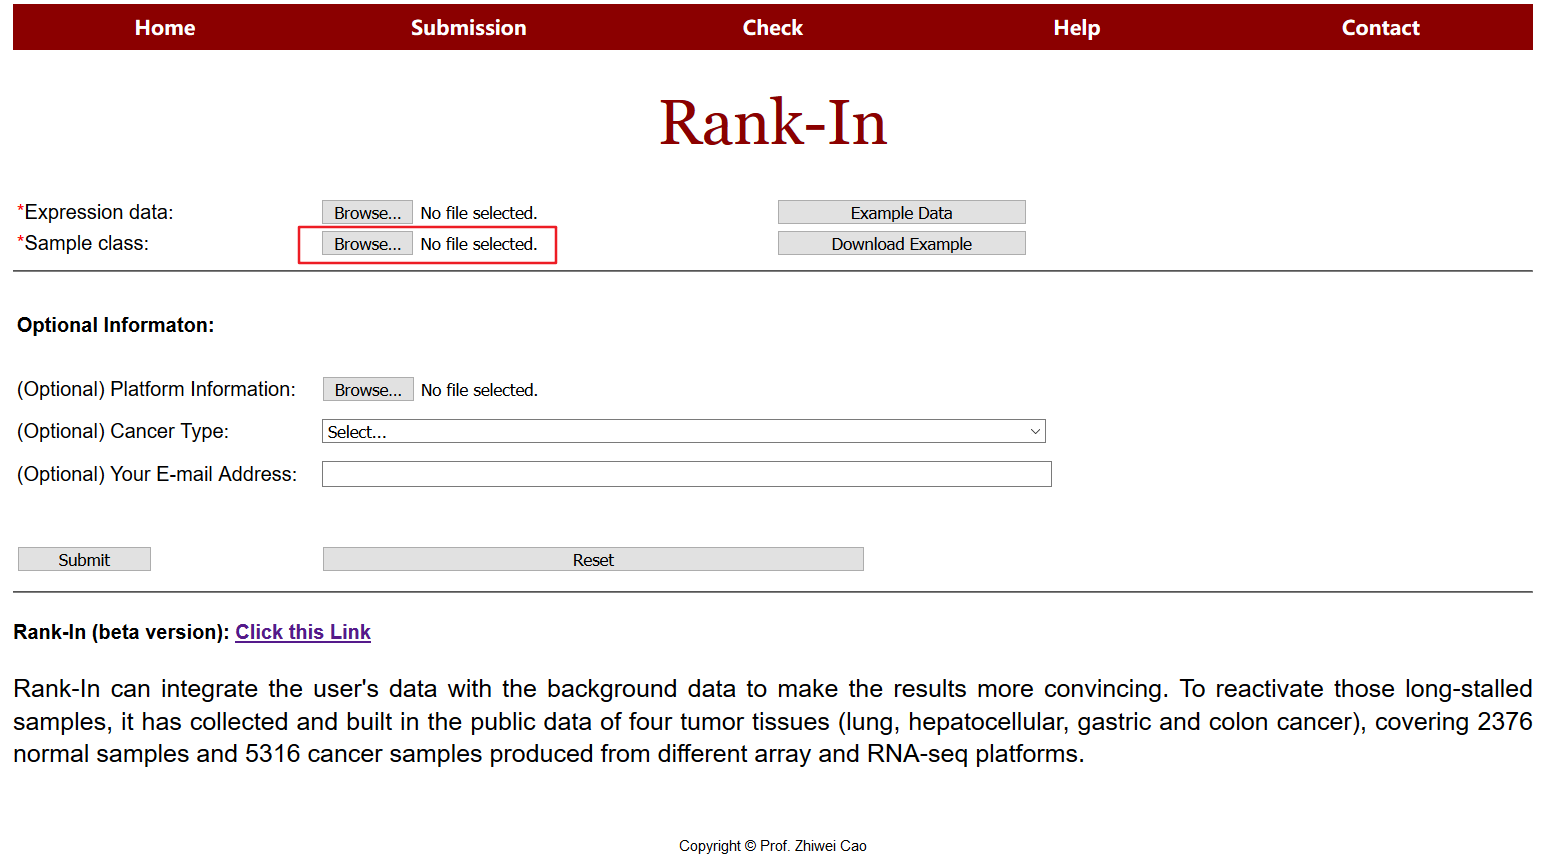
Table3 format of class data
| #sample | #class |
| sample1 | 1 |
| sample2 | 1 |
| sample3 | 2 |
| sample4 | 3 |
2.2 Additional information submission (optional)
Uses are encouraged to upload additional information such as platforms, batches and so on. For example, in platform column, “1” means data form Affymetrix U133 plus2 platform, “2” means data from Agilent microarray, “3” means data from Illumina Hiseq 2000 and so on.
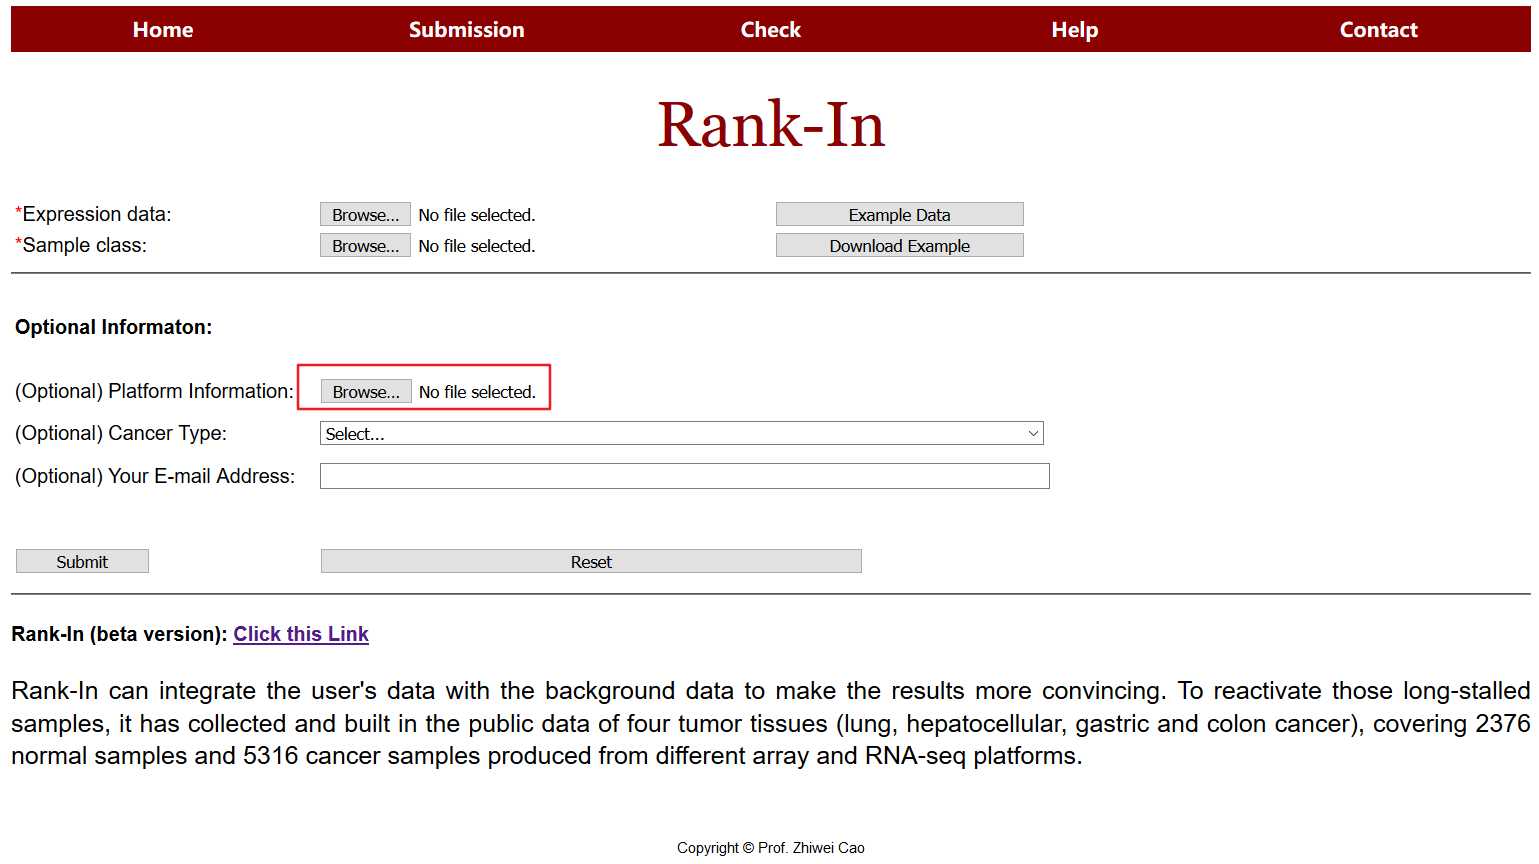
Table4 format of additional information
| #sample | #platform |
| sample1 | 1 |
| sample2 | 1 |
| sample3 | 2 |
| sample4 | 3 |
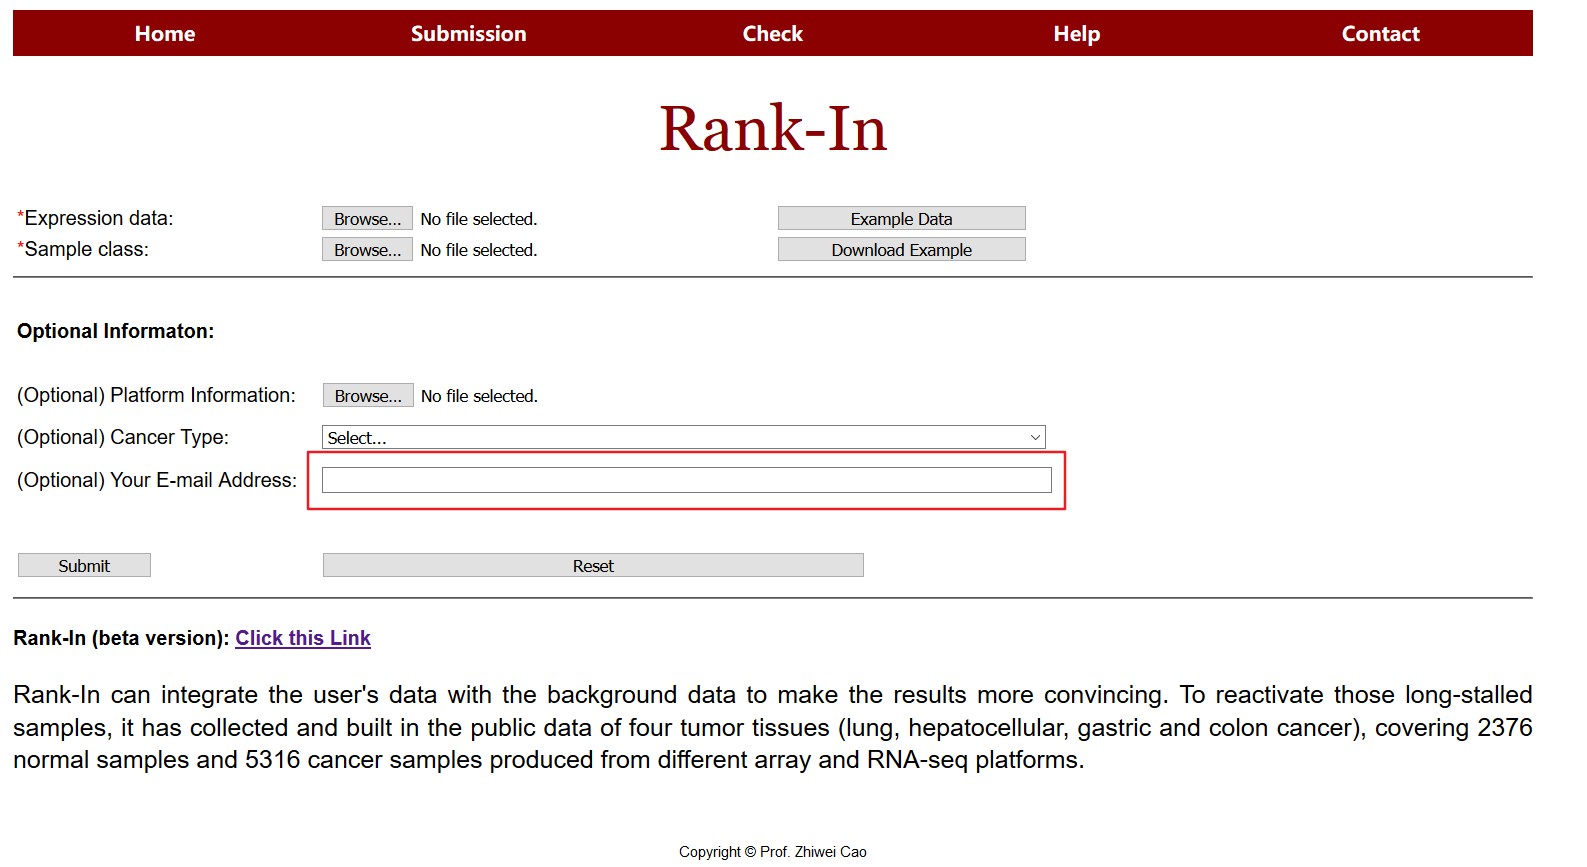
3. Email address (optional)
Results will be sent via email after computation. It is highly recommended for users to choose this option.
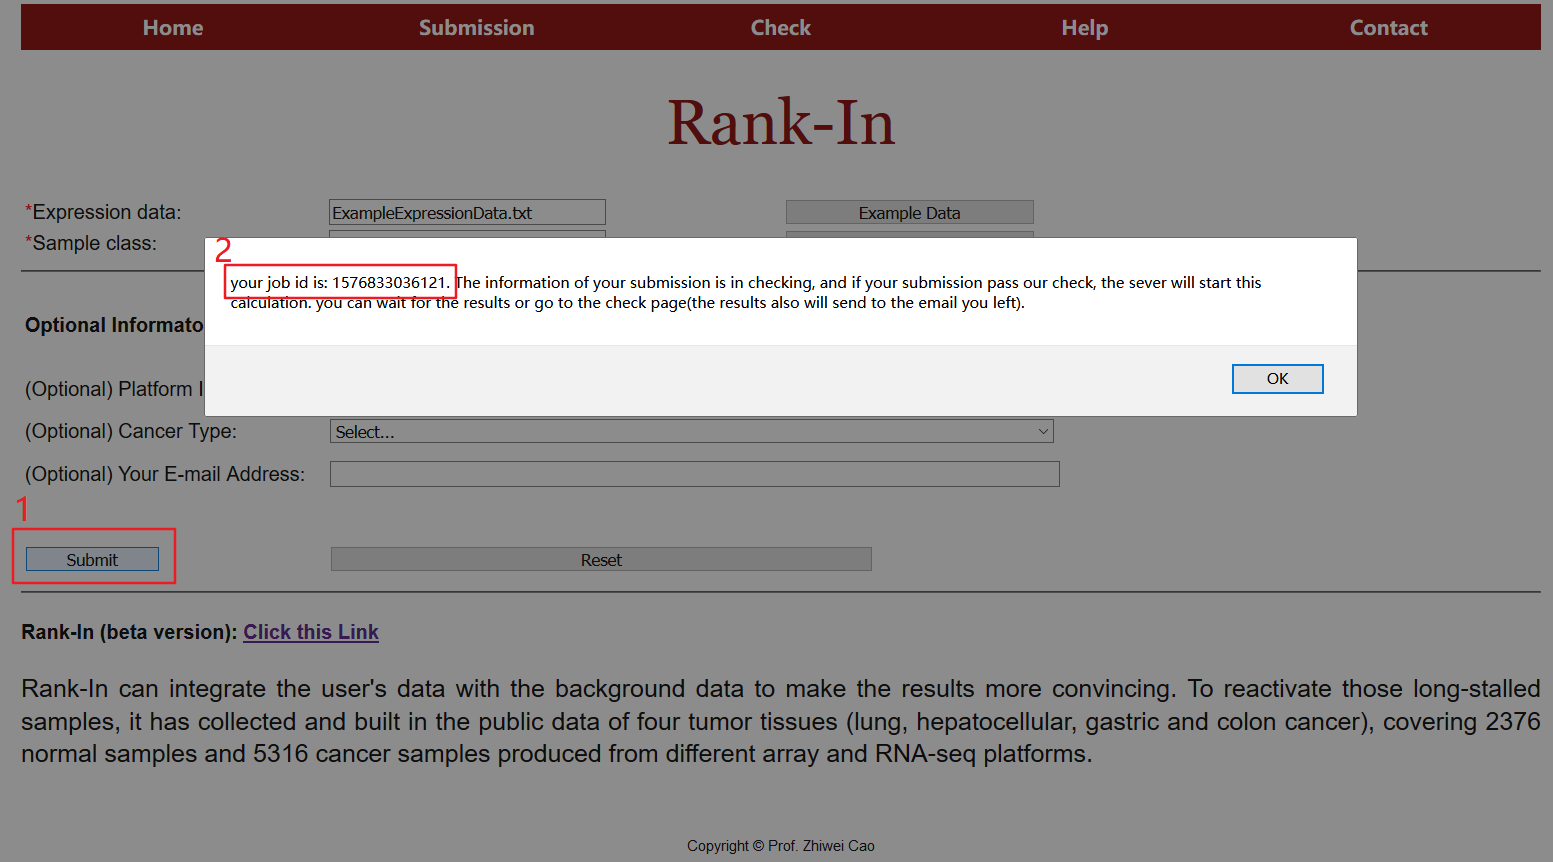
4. Submission
Press the "Submit" button to start the computation. A job id will be provided and a new page will be linked to the results. The page will be refreshed automatically when results are available.
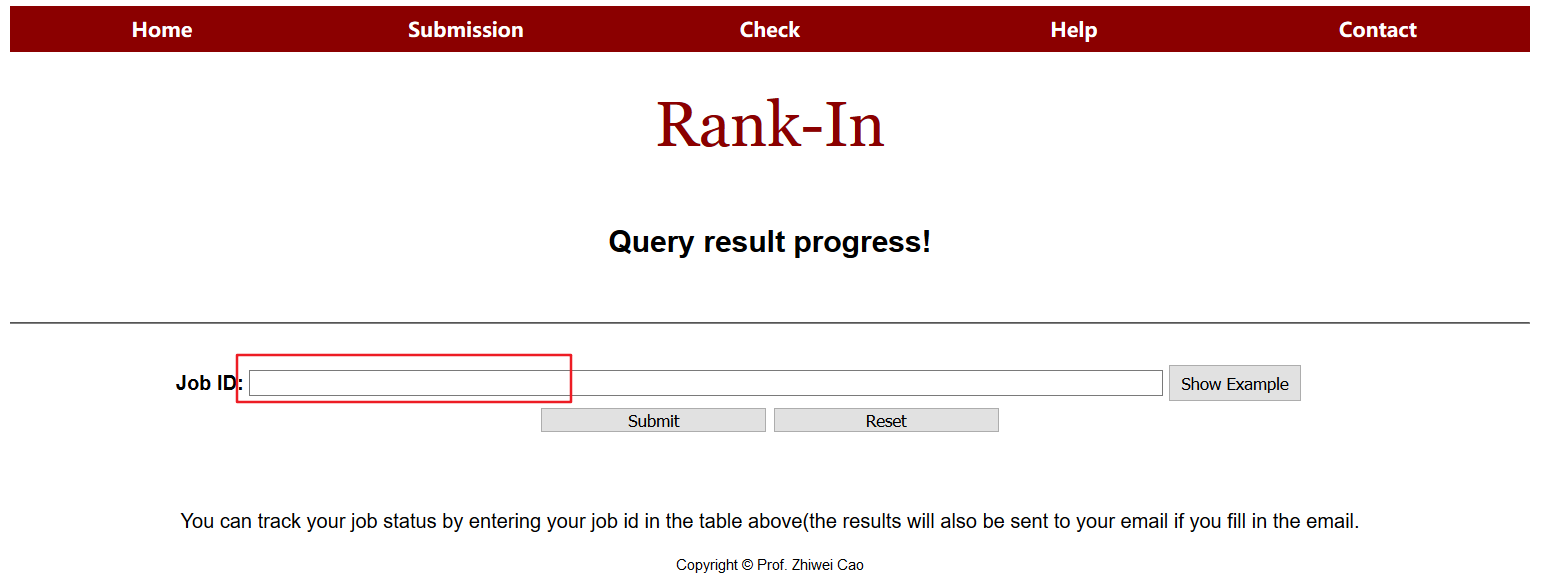
5. Status check
User can track the job status by entering a job id in the table above.
B. Example
1. Submission
Click on submission in the navigation of the homepage to use the tool.
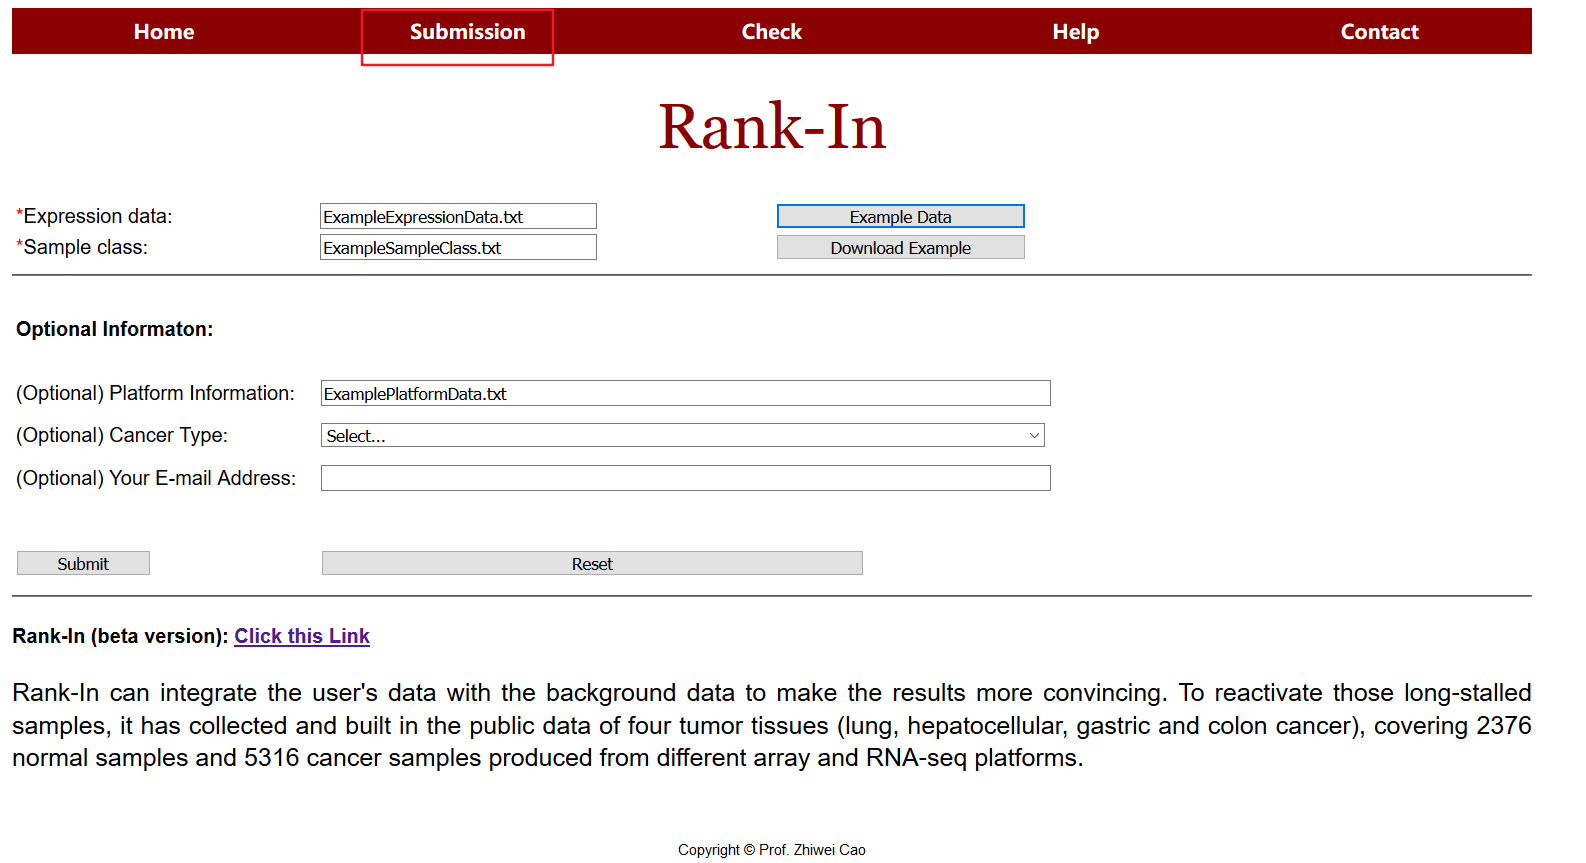
1.1 Expression data
Examples are derived from TCGA, including glioma (GBMLGG) samples and healthy samples, each sample was sequenced on two platforms (RNA-seq, Microarray).
Submit expression data in the submission interface, the upload data should contains expression matrix saved as a tab delimited text file (.txt) with rows for genes and columns for samples.
1.2 Class data
Submit Sample class in the submission interface, users will upload a class file additionally, which numbers the type of samples, in the example, “1” means samples from tumor tissue, “0” means samples of normal tissue.
2. Results
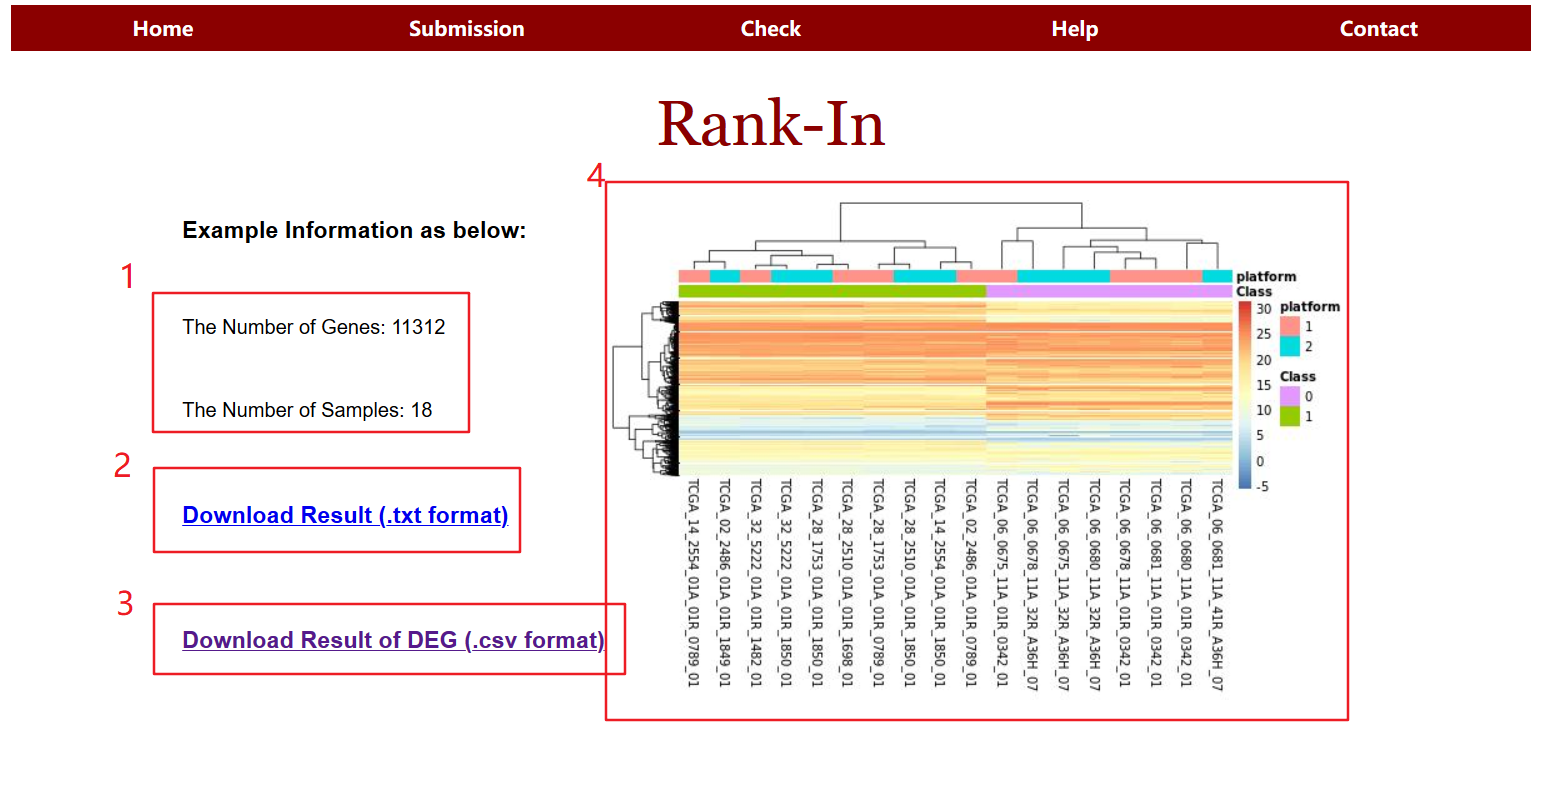
2.1 Information of the result page
The results page consists of the following four sections:
1> Description of data submitted by the user (gene number,sample number)
2> Gene expression profile obtained by Rank-In
3> Difference gene file (csv format)
4> Gene unsupervised clustering graph
2.2 Results of integrated cancer transcriptomics data
In this table, the original expression profiles have been transformed into adjusted internal gene ranks. For each gene, the bigger of the adjusted rank, the stronger of the expression.

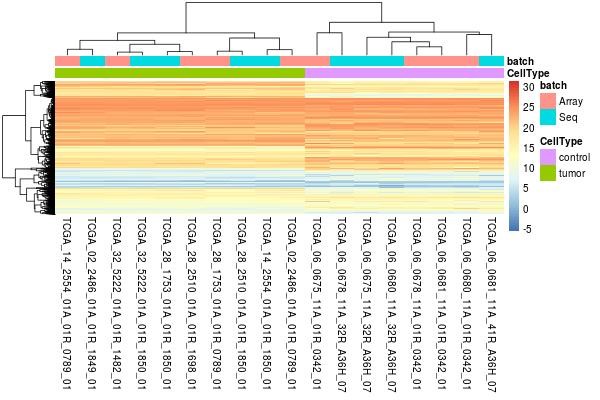
2.3 visualization of processed data
Heatmap is provided to help users to visualize whether the samples are unsupervised grouped according to biological class, which is generally indicative that the comparable of cross-platform data. Each square represents each gene, and its color represents the expression level of the gene. The larger the expression level, the darker the color (red is up-regulated, blue is down-regulated). Each row represents the expression level of each gene in different samples, and each column represents the expression level of all genes in each sample. The upper tree graph shows the clustering analysis results of different samples from different experimental groups, and the left tree graph shows the clustering analysis results of different genes from different samples. In this picture, the samples are unsupervised clustered according to cancer and control, which means the technology bias between microarray and RNA-seq would be removed.
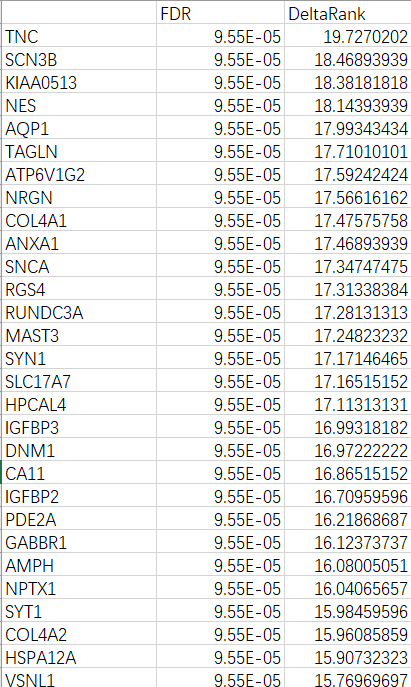
2.4 Differentially expressed genes
The commonly used method Benjamini & Hochberg false discovery rate (FDR) is calculated to obtain a good balance between discovery of statistically significant genes and limitation of false positives.
Results are presented as a table of genes with FDR and the absolute value of DeltaRank. Genes with the Largest DeltaRank values will be the most reliable.
The complete result table may be saved. The downloaded files are tab-delimited and suitable for opening in a spreadsheet application such as Excel.
C. Browser compatibility
| OS | Version | Chrome | FireFox | Microsoft Edge | Safari |
| Linux | 4.13.0(ubuntu17.10) | 71.0.3578.98 | 61.0.1 | n/a | n/a |
| MacOS | Catalina 10.15 | 78.0.3904.108 | 70.0 | n/a | 13.0.2 |
| Windows | 10.0.17134 | 78.0.3904.108 | 70.0.1 | 42.17134.1.0 | n/a |