How to use SEPPA 3.0
1. Submission entrance
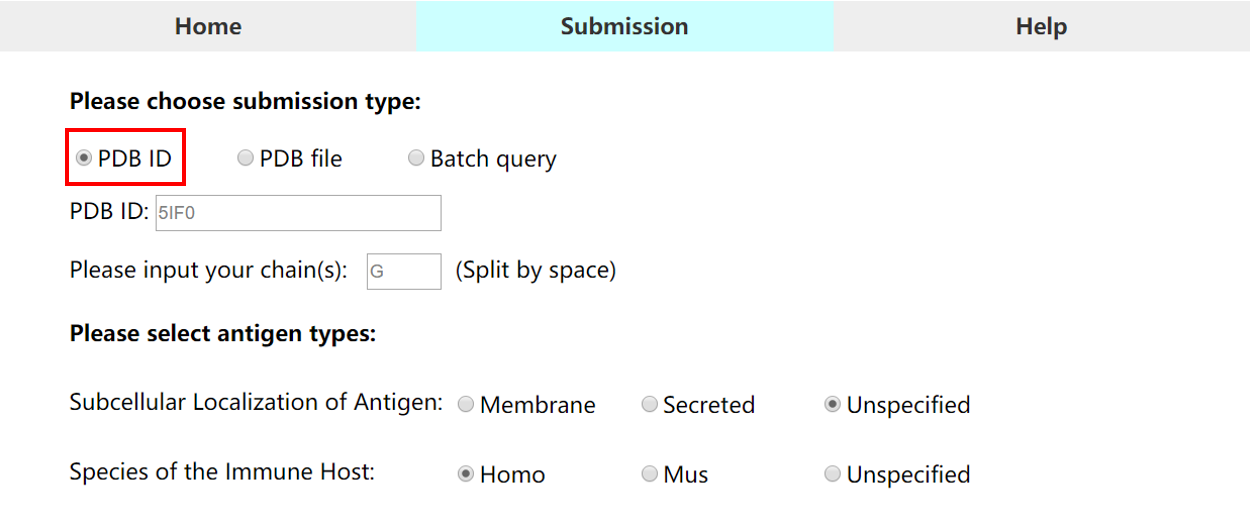
• Submission type 1 (PDB ID): Users can submit the entry of an existing PDB ID (4 characters)
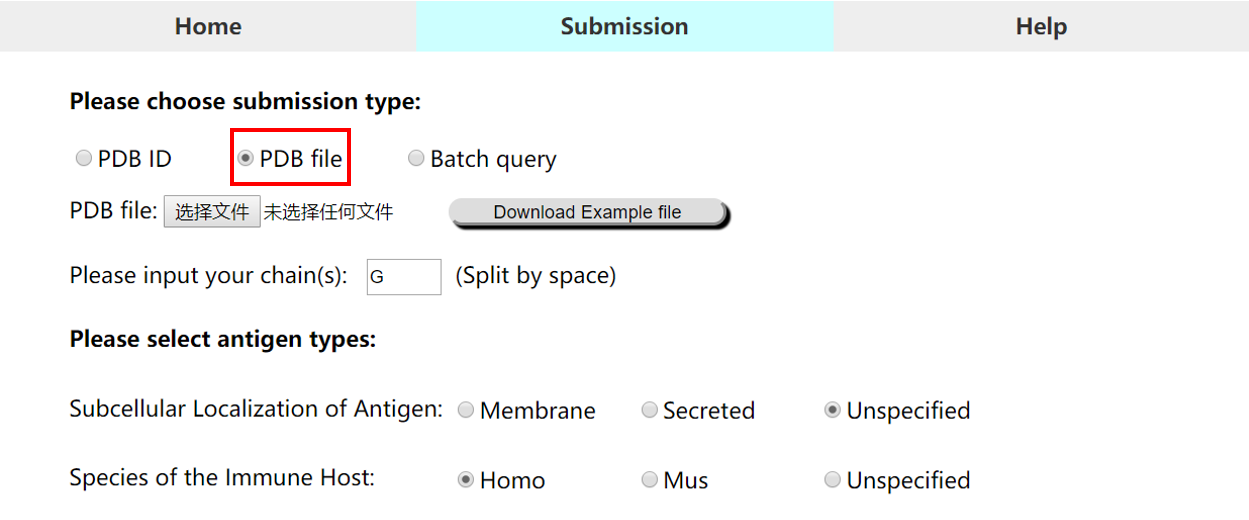
• Submission type 2 (PDB file): Users can submit their own protein structures in PDB format
For above types, please note that:
1) The chain(s) ID should be specified in each submission type.
2) If the chain is not specified, please type in "+", and the whole structure will be calculated separately.
3) For local PDB file, please note that chain column cannot be empty. Any chain ID with characters ("0-9" or "A-Z") is accepted.
4) For local PDB files, the filenames are only allowed to cover the following characters: "0-9" , "A-Z" or 'a-z'.
5) If you need to submit your local PDB files in batch, you can click here to download the Python code.
• Submission type 3 (Batch query): Users can submit multiple PDB ID entries in batch query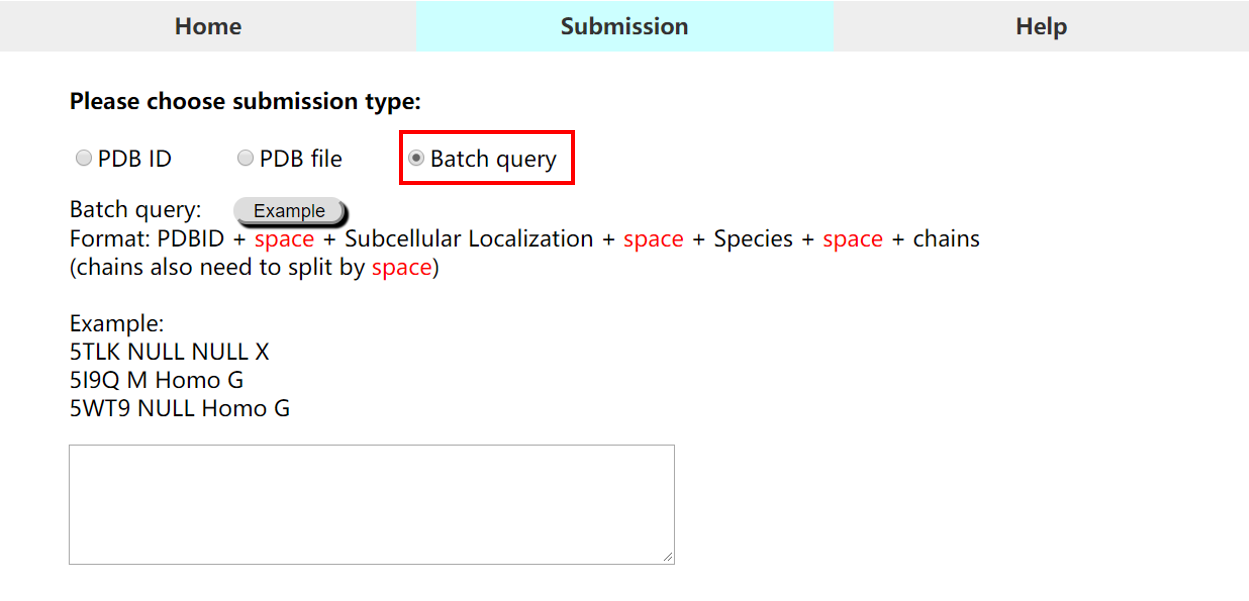
For batch query, please note that:
1) For each entry, users should specify PDB ID, subcellular localization, host specie and chain ID(s), which are separated with space(s) in one line.
2) In batch query mode, each PDB entry is set as one line in below format:
"PDB ID(4 characters) + single space + 1 character of subcellular localization + single space + host specie
+ single space + chain ID X + Chain ID Y ... "
Subcellular Localization of Antigen:
M: Membrane | S: Secreted | NULL: not specified
Species of the Immune Host:
Homo: Human | Mus: Mouse  | NULL: not known or Others
2. Example
Example:
PDB ID:5IF0
Chain :G
Information selected:
Subcellular localization: Unspecified
Host of species: Unspecified
Part I: summary of the prediction result
Antigenic Prediction for 5IF0:

Chain: G
Threshold: 0.089
Antigen Protein Subcellular Localization: Unspecified
Species of Host: Unspecified
Number of total residues: 169
Number of predicted epitope residues under this threshold: 60
This part is a summary of the prediction result.
Part II: visualization of the prediction result
View 3D structure in Jmol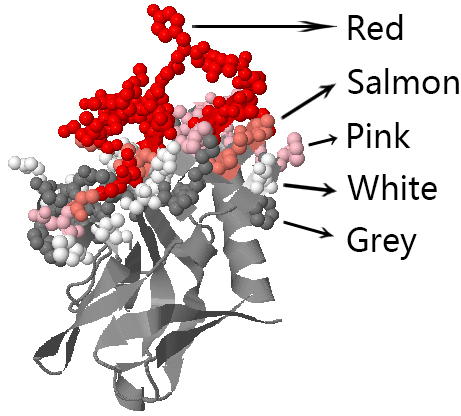
Visualization of SEPPA3.0 prediction result.
The 3D structure of antigen is showed by Jmol.
And the predicted epitopes will be labelled in color when you check the box.
All another operations are same as Jmol.
* colors means predicted score:
     Red:	[0.2,1.0]
     Salmon:	[0.17,0.2)
     Pink:	[0.14,0.17)
     White:	[0.11,0.14)
     Grey:	[threshold, 0.11)
Part III: a glance of the prediction result
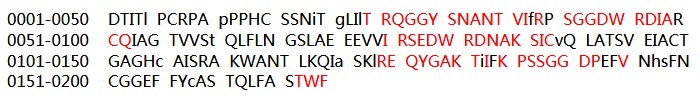
The prediction result is displayed in a table as above.
Residues are listed sequentially.
The predicted epitope residues are highlighted in red.
The core residues are shown in lowercase.
Part IV: score file of the prediction result (.txt)
chainID	resSeq	resName	score	location
G	1	ASP	0.032	surface
G	2	THR	0.031	surface
G	3	ILE	0.029	surface
…
G	147	HIS	0.000	core
G	148	SER	0.000	core
G	149	PHE	0.041	surface
…
G	167	THR	0.138	surface
G	168	TRP	0.102	surface
G	169	PHE	0.162	surface

Under the given threshold(0.089),
The residues G1, G2 and G3 are predicted as non-epitope residues.
The residues G147 and G148 are predicted as core ones.
The residues G167, G168 and G169 are predicted as epitope ones.
The complete score file contains five columns, which are chain ID,
residue sequence number, residue name, SEPPA3.0 score and residue location.
Part V: pdb file of the prediction result (.pdb)
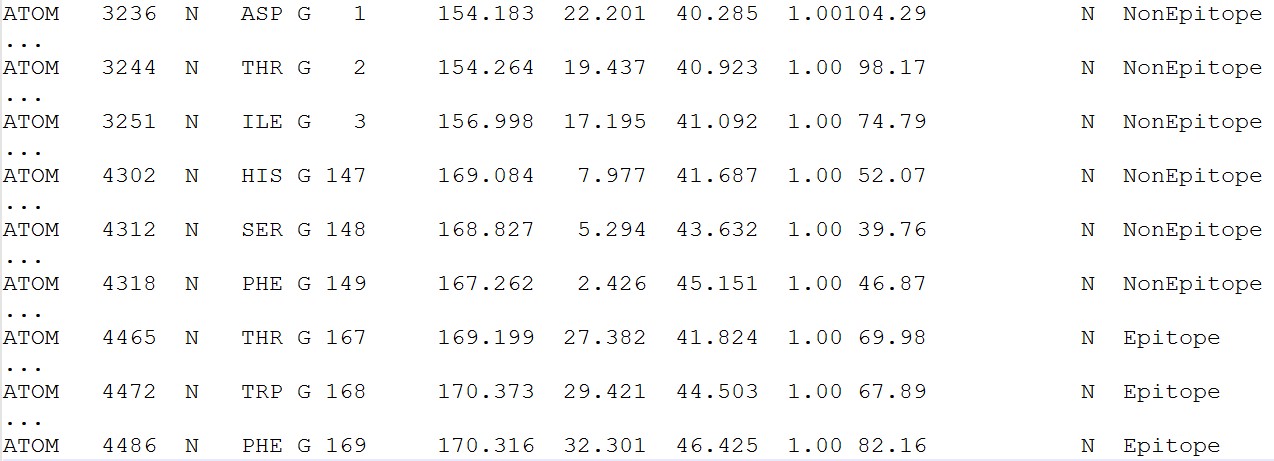
According to predict score, a classification label was added in the PDB file,
which were marked as "Epitope" and "NonEpitope".
"Epitope" represent the residue predicted as epitope residue,
such as G167, G168 , G169
"NonEpitope" represent the residue predicted as non-epitope residue or core residue,
such as G1, G2, G3, G147, G148, G149.
3. Browser compatibility
| OS | Version | Chrome | Firefox | Microsoft Edge | Safari |
| Linux | 4.13.0(ubuntu17.10) | 71.0.3578.98 | 61.0.1 | n/a | n/a |
| MacOS | 10.13.6 | 70.0.3538.110 | 61.0.2 | n/a | 12.0.2 |
| Windows | 10.0.17134 | 71.0.3578.98 | 64.0 | 42.17134.1.0 | n/a |
| Windows | 7 | 50.0.2661.102 | 64.0 | n/a | n/a |
ANNOUNCEMENT:
The residue solvent accessible areas are calculated with Naccess V2.1.1.Hubbard SJ, Thornton JM. 'NACCESS', Computer Program.
Department of Biochemistry and Molecular Biology, University College London. 1993.
Jmol has been implemented into SEPPA3.0 server.
Jmol: an open-source Java viewer for chemical structures in 3D. http://www.jmol.org/